


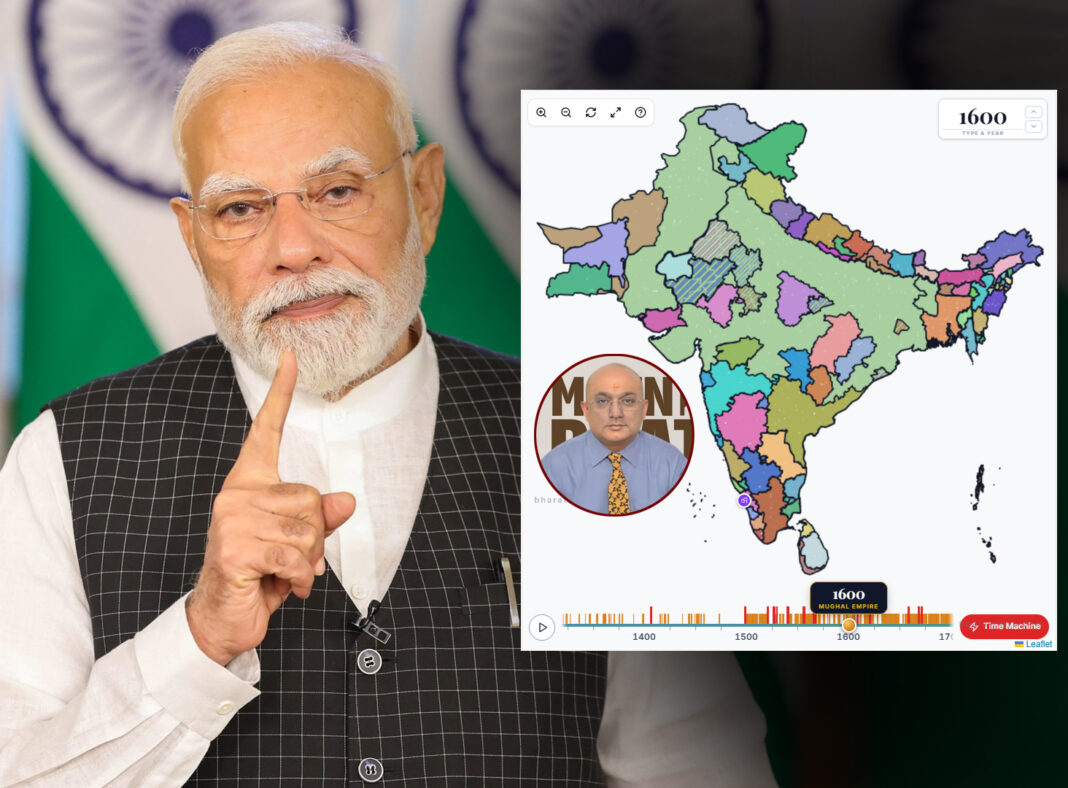
Prime Minister Narendra Modi praised Mumbai-based Krishna Seshadri during the 137th episode of Mann Ki Baat for developing BharatRajya(www.bharatrajya.com), an interactive digital historical atlas. Lacking prior programming experience, Seshadri utilized Anthropic’s Claude AI model to build the website, fulfilling a fifteen-year vision. The platform maps over eight centuries of regional Indian rulers across nearly one thousand districts, releasing all historical mapping data under a Creative Commons Zero license.
Krishna Seshadri, a marketing professional with an engineering and business administration background, conceptualized a digital historical map of India fifteen years ago. Lacking technical software development skills, he successfully built the platform by leveraging Anthropic’s generative artificial intelligence model, Claude. Seshadri famously noted that his prior relation to code was merely his postal pin code, demonstrating how modern AI tools allow non-technical creators to build complex database applications.
PM Modi Praises Krishna Seshadri:
Prime Minister Narendra Modi highlighted Seshadri’s initiative during the 137th episode of his monthly radio broadcast, Mann Ki Baat, after encountering the project on social media. In a direct phone conversation featured on the broadcast, Modi praised the website’s storytelling approach to making regional history engaging and accessible to the public. The recognition emphasizes the national importance of preserving cultural heritage through innovative technological solutions, inspiring next-generation creators to harness artificial intelligence for educational progress.
Also Read: Every File has a KinPin; Sr. IAS Emotional Post While Resignation
The BharatRajya website serves as an interactive historical atlas covering roughly one thousand districts across more than eight centuries of Indian history, spanning from 700 CE into the modern era. Users can manipulate a digital timeline slider to instantly visualize which royal dynasty or sovereign held authority over specific geographic regions at any given point in time. To support open education, the underlying historical mapping data is distributed under a Creative Commons Zero license, allowing teachers, researchers, and students to freely explore, adapt, and share the historical visualization.
